The four types of SaaS churn and how to calculate them
By
Alex Atkins
August 31, 2023
•
5 min read
Customer churn is a term often used in the SaaS world, but what does it actually mean?
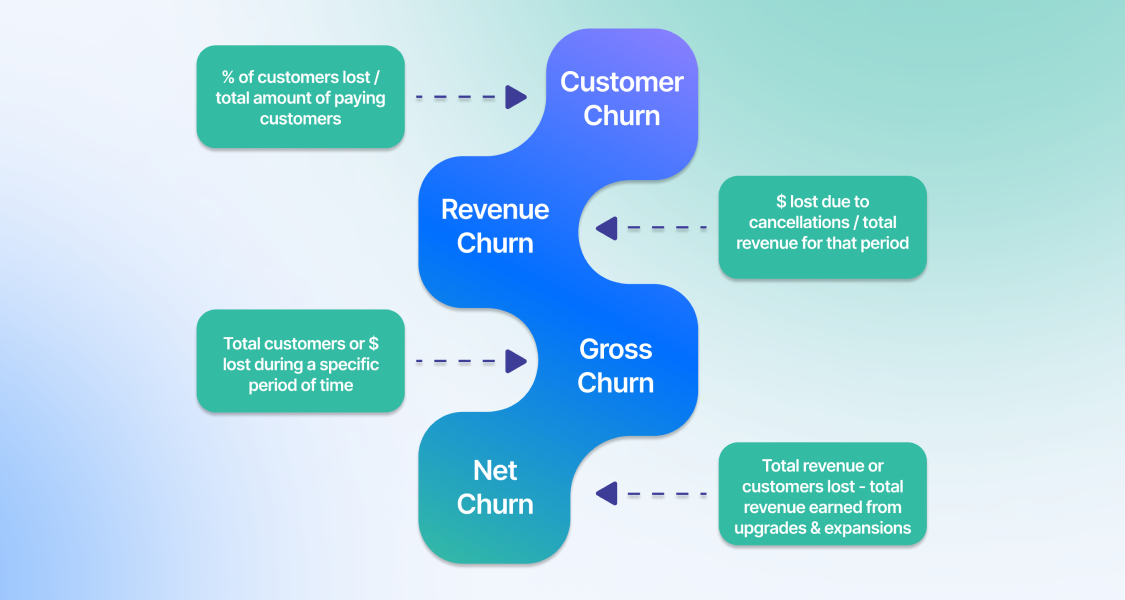
Simply put, churn is the rate at which customers are lost. These are customers that have canceled your service and aren’t coming back. It can be calculated for individual customers (B2C) or for an entire company (B2B). Four different types of churn are commonly measured: customer churn, revenue churn, gross churn rate, and net churn rate. Let's take a closer look at each type.
Customer churn rate calculation
Customer Churn
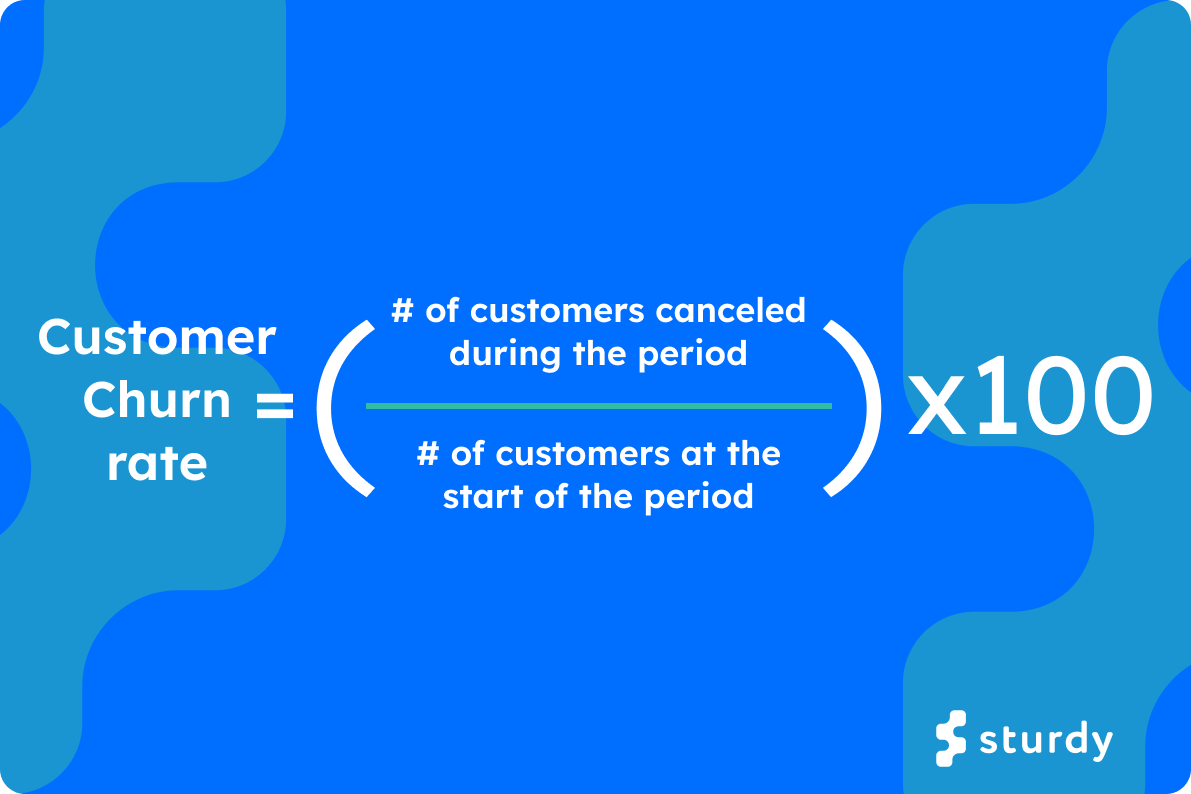
Customer churn is the most commonly used type of churn. It is the percentage of customers that stopped using your company's products or services during a specific time frame. You can calculate your customer churn rate by dividing the number of customers you lost during that period — say a quarter — by the number of customers you had at the beginning of that period.
Let’s pretend for a moment that you work on the growth team at SaaS.io, a new (you guessed it) SaaS startup. Over the last few months, SaaS.io has continued to grow hand over fist with little to no customer churn. However, customer acquisition has begun to slow, and your boss is asking you to calculate the customer churn rate in October. This equation is relatively straightforward. At the beginning of October, Saas.io had 54 customers. However, by the end of the month, two had churned. That means your customer churn rate in the month of October was 3.7%.
1. Total customers at the beginning of a period: 54
2. Number of customers lost in period: 2
3. Customer Churn Rate = (2/54)*100 = 3.7% (that is a great number, by the way)
Revenue churn rate calculation
Revenue Churn
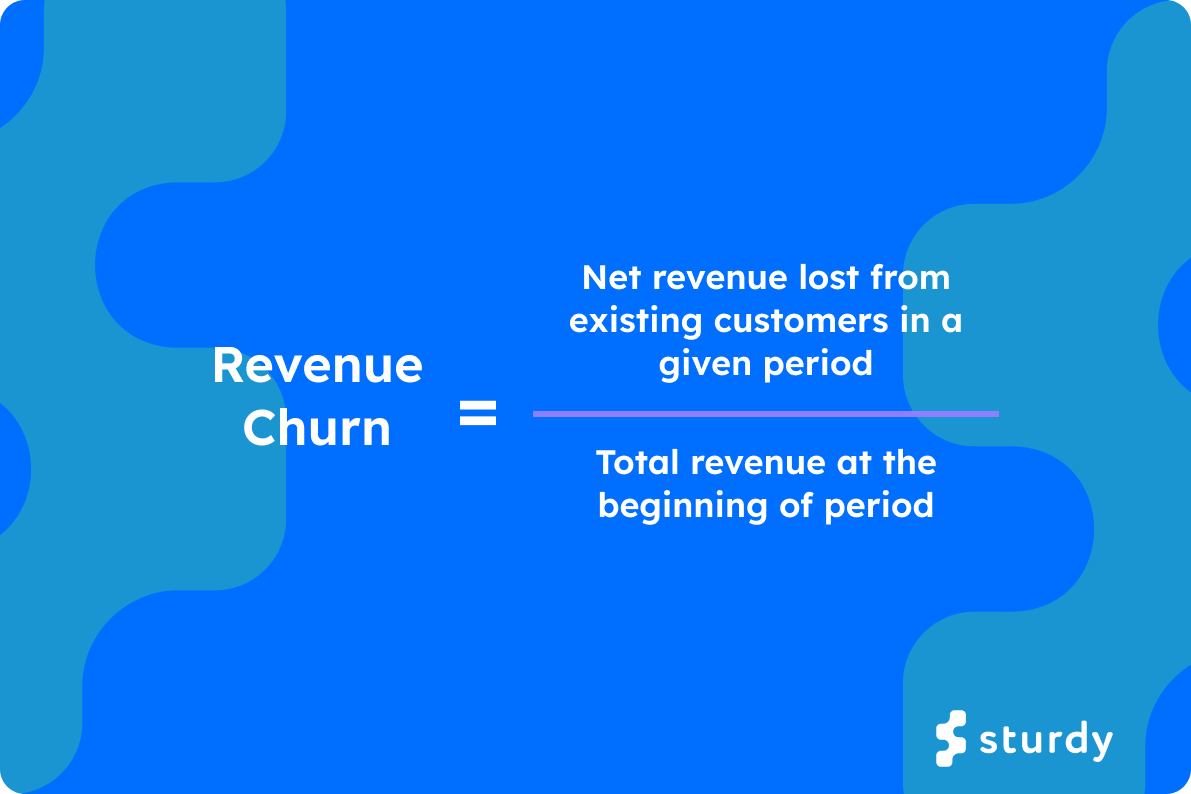
Revenue churn is similar to customer churn, but instead of measuring customers leaving the company, it measures the amount of revenue lost due to customers who have left or downgraded their plans. To calculate revenue churn, divide the total amount of revenue lost in a certain period by the total revenue at the beginning of that period.
If we head back to our SaaS.io example, it’s important to note that the October revenue churn is much scarier than the customer churn. Yes, only two customers churned, meaning there was a 3.7% customer churn rate. However, one of those customers (Customer 2) accounted for 11% of MRR (monthly recurring revenue). Customer 1 generated only $6,000 in MRR, whereas Customer 2 generated $22,000 MRR. That means that at the beginning of October, SaaS.io’s MRR was $200,000. By the end of October, the revenue churn was .14.
1. Total revenue at the beginning of a period: $200,000
2. Net revenue lost in period: $6,000 + $22,000 = $28,000
3. Revenue Churn Rate = $28,000/$200,000 = .14
Gross MRR churn equation
Gross Churn Rate
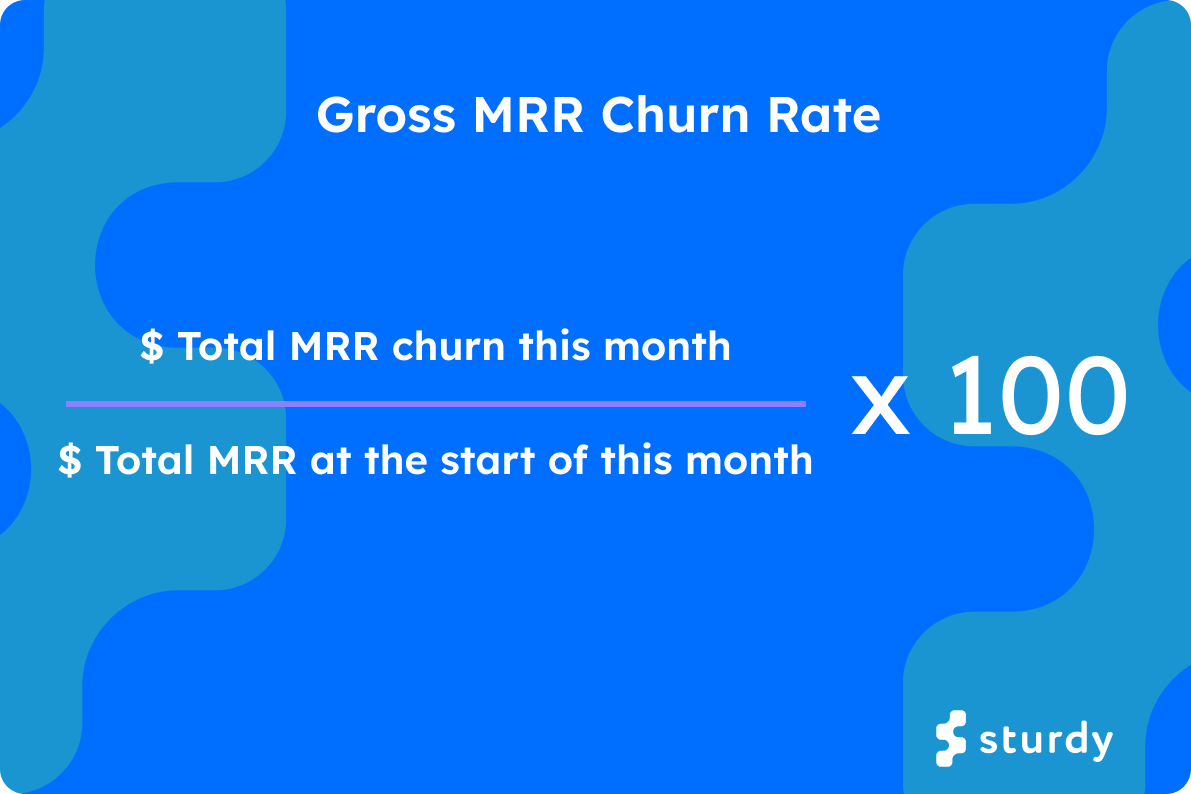
The Gross churn rate takes into account both customer and revenue churn. It measures the total number of customers and revenue lost in a certain period, divided by the total number of customers and revenue at the beginning. This gives an overall picture of how much business is lost in a given time frame.
If we apply this to SaaS.io, the MRR for October was $200,000, and users canceled $28,000 worth of contracts. That means the gross churn rate will be 14%
1. Total revenue at the beginning of a period: $200,000
2. Net revenue lost in period: $6,000 + $22,000 = $28,000
3. Gross Churn Rate = ($28,000/$200,000) x 100% = 14%
Net churn rate calculation
Net Churn Rate
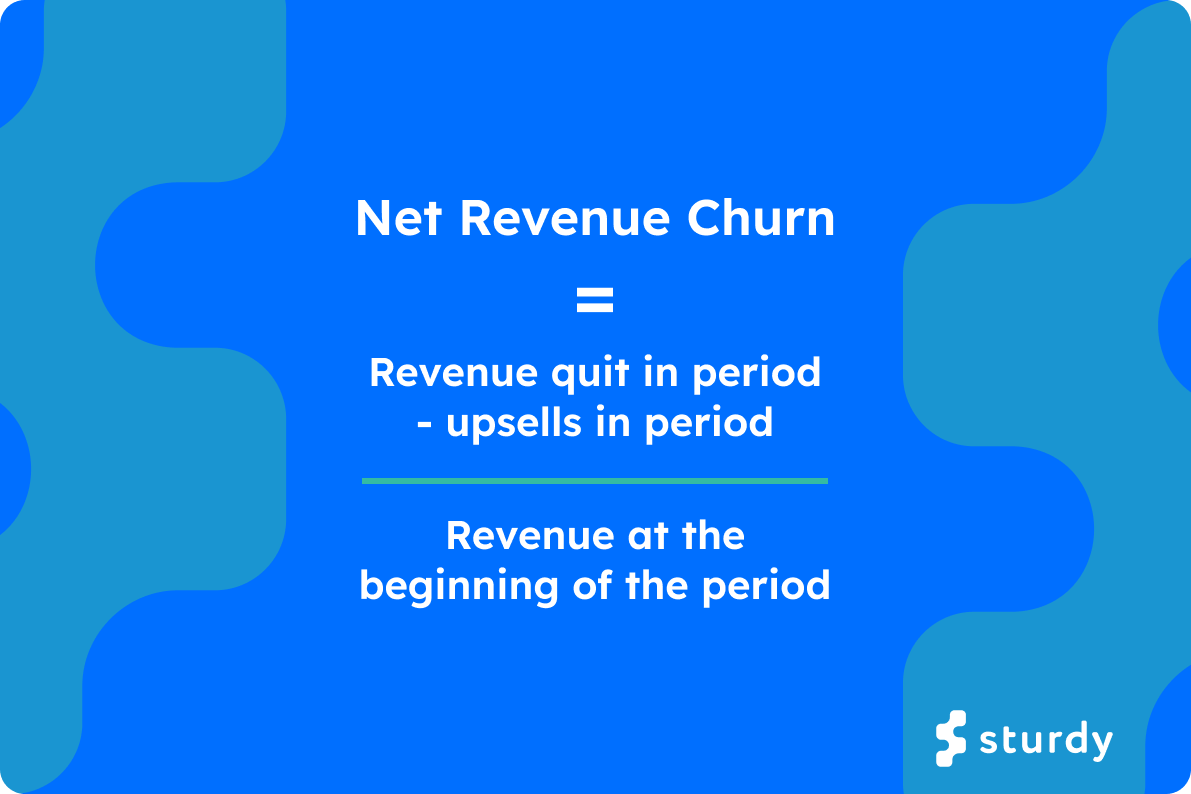
Net churn rate considers both customer and revenue churn. However, it also includes new customers and expansion revenue acquired in a certain period. Expansion revenue is the additional revenue you generate from existing customers through upsells, cross-sells, or add-ons. That’s why net revenue churn gives an overall picture of how much business is being gained or lost in a given time frame.
A month has passed since those two customers, and 14% of gross MRR was lost. Saas.io is currently at $172,000 MRR in November, as no additional sales have been made. Unfortunately, November has also seen $12,000 in contract losses. Luckily for Saas.io, a few existing customers have upgraded their plans, generating an additional $10,000 in revenue. Your boss asks you what the net churn rate for November is. First, you must subtract the customer upgrade revenue from the revenue lost in downgrades and cancellations. Then, divide that number by the revenue at the beginning of November.
1. Total revenue at the beginning of a period: $172,000
2. Net revenue lost in period: $12,000 - $10,000 = $2,000
Kellogg defines the leaky bucket equation as “Starting ARR + new ARR - churn ARR = ending ARR”.
If we apply this to our Saas.io example, we can determine that the starting ARR in the fourth quarter (Q4) of 2022 was roughly $400,000. The new ARR in Q4 ‘22 was $56,000, and the Churn ARR in that same time period was $45,000. In other words:
Churn is an important metric to track for any SaaS company, as it can be used to identify trends, measure loyalty, and assess the effectiveness of customer retention strategies. Calculating churn rates can help companies identify which customers are more likely to leave and which types of customers are the most valuable. By understanding churn, businesses can take steps to improve customer retention and keep their business running smoothly.
What Deterministic AI Actually Means for Enterprise Revenue Teams
Joel Passen
June 3, 2026
•
5 min read
§ 1: The Setup
More signal, less action
Revenue teams have never had access to more AI-generated output. Intent signals, engagement scores, pipeline risk flags, account summaries generated from CRM data, recommended next actions populated into dashboards before the morning standup. The tools are proliferating. The outputs are multiplying. And yet, in most enterprise GTM organizations, the conversion from AI insight to actual decision is stagnating or declining.
The default diagnosis is a model problem or a product problem. The model is not accurate enough. The tool is not integrated deeply enough. The outputs are not surfaced in the right workflow. These are real friction points, but they are not the root cause. Fixing them at the application layer produces better-looking noise, not better decisions.
The actual problem is architectural, and it sits one layer below the model. Enterprise revenue data arrives fragmented: the same account exists as four different entities across Salesforce, Gong, HubSpot, and Zendesk. Engagement signals carry different timestamps, different field schemas, different definitions of what counts as a meaningful interaction. Permissions are enforced inconsistently, or not at all, before context reaches the model. When the model reasons over this, it is not reasoning over your business. It is reasoning over a probabilistic reconstruction of your business, assembled at runtime from inputs that contradict each other.
The result is outputs that teams cannot validate, cannot trace, and eventually stop trusting. The insight-to-action gap is not a UX problem. It is a data preparation problem that most organizations have not yet named correctly.
None of these data problems are new. Revenue systems have been fragmented for decades. What changed is that analysts used to perform the reconciliation manually. AI systems consume context directly. Every unresolved identity, duplicated record, and permission inconsistency that once slowed down an analyst now becomes part of the model's reasoning process. The rise of AI did not create the context problem. It exposed it.
Core argument: When the context layer is broken, no model is accurate enough. When it is built correctly, model selection becomes a secondary decision.
§ 2: Failure Patterns
Three failure patterns revenue teams actually recognize
The breakdown follows predictable patterns. Understanding the mechanism behind each one clarifies why application-layer fixes keep failing to address them.
Too many signals, no resolution. Modern GTM stacks produce a high volume of engagement data: web activity, intent signals, email opens, CRM updates, product usage events, support tickets. The problem is not the volume. The problem is that the same customer arrives as multiple disconnected records, each carrying a fragment of a complete picture. When retrieval pulls context for a model to reason over, it assembles a window full of candidates that may represent the same entity under four different identifiers. The model filters and weighs this noise because nothing upstream resolved it. That filtering costs tokens, introduces error, and produces outputs with confidence levels that cannot be verified against a ground truth. Teams receive a prioritization recommendation that reflects the quality of the retrieval, not the reality of the account.
Scores that cannot be traced. A high-priority account flag, a churn risk score, a pipeline confidence number. These outputs only change behavior if the team receiving them can validate the reasoning. When the underlying signals are fragmented, duplicated, or sourced from systems with inconsistent definitions, the model's output is not traceable to a specific set of inputs. The recommendation is real, but the path from data to conclusion runs through a retrieval process no one can inspect. Teams hesitate, override, or ignore, not because the model is wrong, but because they have no way to confirm it is right. Explainability is a function of what the model received, not just how it reasoned.
Insights that do not survive the handoff. Revenue organizations run across systems. Marketing works in attribution platforms. Sales lives in CRM. RevOps reconciles both. An AI output generated in one system rarely arrives intact in another, because the entity it references does not have a consistent identity across those systems. The account that marketing flagged as highly engaged is not the same record that sales sees as low-activity, because no layer upstream has collapsed them into a single resolved entity. Until that resolution exists at the infrastructure level, the handoff problem cannot be solved by adding more integrations or better dashboards. The data layer itself is fragmented, and every insight built on top of it inherits that fragmentation.
§ 3: The Wrong Fix and the Right One
What does not fix this
The instinct is to upgrade the model, add an explainability layer, or build a better scoring dashboard. Each of these moves addresses the wrong layer. A more capable model reasoning over unresolved, fragmented context produces more confident wrong answers, because the model has no way to know that the four records it is reasoning over represent the same customer. It treats the fragments as distinct signals and synthesizes accordingly. An explainability layer that traces outputs back to fragmented inputs does not fix the problem; it makes the fragmentation visible, which is useful diagnostically but does nothing to resolve it. A better dashboard surfaces the noise with higher production value.
The fix belongs at the layer that prepares context before the model ever sees it. This means infrastructure that resolves entities across systems into a single canonical record, compresses and classifies signals before retrieval so the model receives structure rather than raw fragments, and enforces access permissions at the data layer rather than relying on the model to honor prompt-level instructions. When that layer is absent, the model performs functions it was not designed for: filtering, deduplicating, guessing at identity, and attempting to honor permissions it received as text rather than as structural constraints. Each of those improvisations introduces error. When the layer is present, the model receives a clean, resolved, permissioned context payload and does the one thing it is actually good at: reasoning over it.
The model is a reasoning engine. It is not a data resolution engine, a deduplication engine, or a permission enforcement engine. Asking it to perform those functions is the architectural mistake that produces untrustworthy outputs.
§ 4: What Deterministic Actually Means
The architecture behind the word
Deterministic AI is often used to describe systems that follow explicit rules rather than probabilistic reasoning. That description is not wrong, but it is incomplete, and it locates the determinism in the wrong place.
A working definition: Deterministic AI is an architecture in which identity resolution, signal preparation, and access control produce the same context payload for the same query every time, allowing probabilistic models to reason from deterministic inputs. The model itself remains probabilistic. What changes is the quality and consistency of what it receives. Determinism is a property of the context layer, not the reasoning layer, and that distinction determines whether outputs can be trusted and traced.
At a practical level, deterministic AI requires three architectural properties: deterministic identity resolution, deterministic signal preparation, and deterministic access control. The remainder of this section explains what each one means and why each one must be present for the system to function reliably.
In practice, this means the following. A customer who exists as "Acme Corp" in Salesforce, "acme-cs" in Slack, and "Acme Internal" in Zendesk does not arrive at the model as three competing fragments. A persistent entity graph resolves those aliases to a single canonical identifier before retrieval begins. Every query involving that customer draws from the same resolved record, regardless of which source system it originated in. The model is told the entity. It is not asked to infer it. That single property eliminates an entire class of retrieval errors and makes every downstream output traceable to a specific, verifiable input.
Signal compression works the same way. A thread of 74 messages is reduced to its load-bearing content by a process that applies the same classification logic on every run, separating bug reports from feature requests from sentiment shifts and discarding noise before the context window is assembled. Permission enforcement operates at the retrieval boundary, not as a prompt instruction the model interprets probabilistically. Records the caller cannot see are excluded upstream, not filtered by instruction. The model never encounters unauthorized data, because the architecture ensures it never arrives.
This is a harder set of properties to build than they sound. Entity resolution across enterprise systems requires sustained investment in a global entity map that tracks canonical identifiers, alias resolution, and source-system metadata. Signal compression requires classification infrastructure that has been trained on the specific communication patterns of the organization. Permission enforcement requires that the retrieval layer has access to source-system ACLs and applies them before assembly. None of these are features. They are the components of a deterministic context layer: infrastructure commitments that compound in value with every source added and every workflow built on top of them. Organizations building this are not configuring a tool. They are constructing deterministic context infrastructure that retains value independently of which model runs on top of it.
§ 4.1: How Deterministic AI Differs from Related Concepts
Deterministic AI vs. retrieval-augmented generation. RAG is a retrieval architecture: it determines what information is made available to a model by fetching relevant documents at query time. Deterministic AI is a data preparation architecture: it determines whether the information was assembled correctly before retrieval begins. A RAG system can retrieve well-matched documents that still contain duplicate entities, unresolved identities, and fragments the model must reconcile on its own. Deterministic context infrastructure resolves those problems upstream, so that whatever RAG retrieves is already clean, canonical, and permissioned. The two are not competing approaches. Deterministic context preparation makes RAG retrieval more reliable by improving the quality of what gets retrieved.
Deterministic AI vs. rules engines. Rules engines determine outcomes through predefined conditional logic: if X then Y. Deterministic AI does not determine outcomes. It determines the consistency and integrity of the context a probabilistic model receives. The model still reasons. The rules engine would replace that reasoning with fixed logic. Deterministic context infrastructure keeps the model's reasoning capability intact while removing the fragmentation and ambiguity that degrade it. The distinction matters because rules engines cannot generalize across novel queries. Deterministic context infrastructure can, because it prepares inputs for a model that can.
Deterministic AI vs. agentic AI. Agentic systems use models to plan and execute multi-step tasks autonomously. Determinism is not a property of the agent architecture; it is a property of the context the agent reasons from. An agent operating on fragmented, unresolved context can plan confidently and execute incorrectly, because the information it reasoned from was ambiguous. Deterministic context infrastructure reduces that risk by ensuring the agent's context is resolved, classified, and permissioned before the agent begins planning. The agent's autonomy is preserved. The probability that it acts on incomplete or unauthorized information is structurally reduced.
§ 5: What Changes
What revenue teams can do when context is right
When the context layer resolves entities, compresses signal, and enforces permissions before the model reasons, the outputs that reach revenue teams change in kind, not just in quality. The difference is not speed or volume. It is traceability: every recommendation connects to a specific, verifiable set of inputs rather than a retrieval process no one can inspect.
Account prioritization becomes auditable. The score reflects what specific contacts did, which content they engaged with, and what the engagement pattern looked like relative to other accounts at a comparable stage, because the model received a resolved account record rather than four fragmented versions of it. When a rep challenges the prioritization, the answer is not "the model said so." It is a traceable path from specific signals to a specific conclusion.
Pipeline risk becomes visible earlier for the same reason. Gaps in engagement, delayed follow-up patterns, and missing stakeholder coverage are detectable from structured context because the model is not trying to reconcile conflicting CRM states at inference time. That reconciliation happened upstream, at the data layer, before the query ran. The risk flag carries a traceable explanation because the inputs that produced it are consistent and auditable.
GTM questions get answered without reconciliation overhead. When marketing and sales refer to the same account, they are drawing from the same canonical entity, resolved before either system ran its query. A question about which campaigns are driving pipeline in a specific territory answers from a single resolved data picture rather than a join across systems that produces different results depending on who runs it and when. The reliability of the answer is a function of the context layer, not the model's reasoning capability.
The cumulative effect is reaching the point at which AI recommendations become reliable enough that teams stop applying manual verification by default and begin acting on outputs with confidence. That shift is not a product capability. It is an architectural property built into the layer that prepares context, and it cannot be reached by improving the model or refining the prompt. It requires that the inputs to the model be resolved, consistent, and permissioned before inference begins.
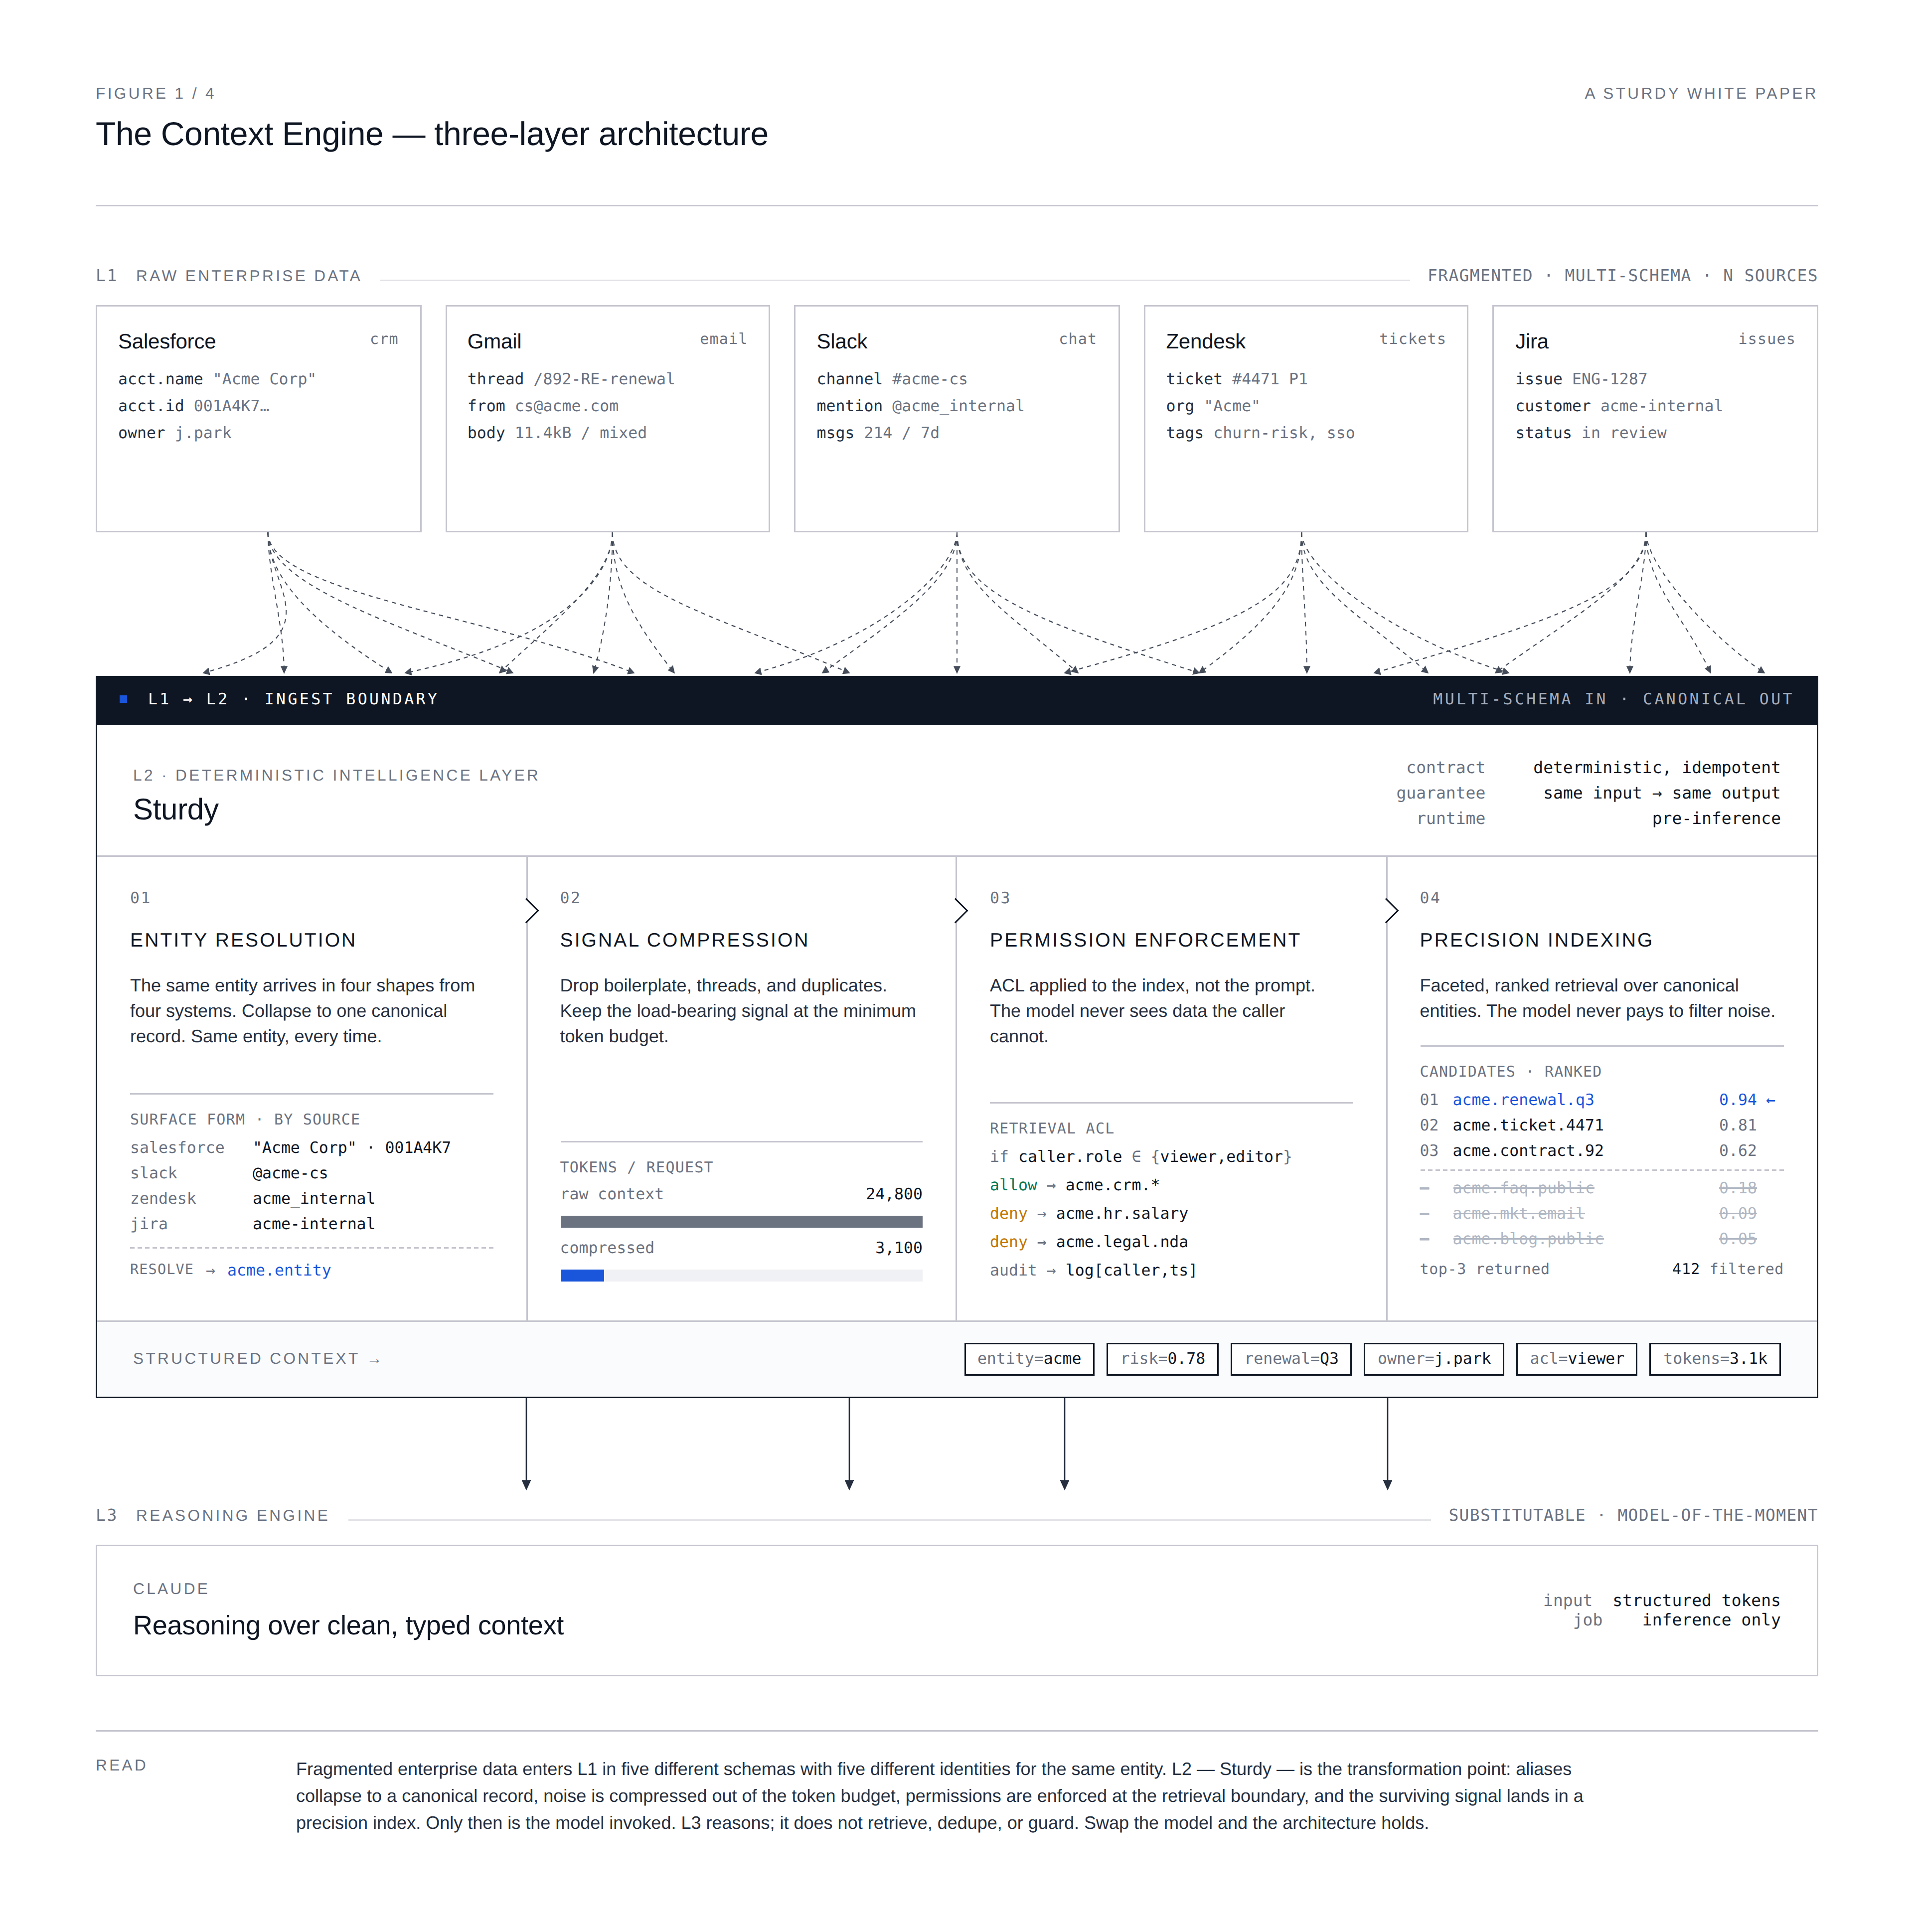
How Sturdy solves this: The context layer, built for revenue data
Sturdy is the infrastructure that sits between your raw data sources and the model. It normalizes entities across Salesforce, Gmail, Slack, Zendesk, Jira, and other systems your revenue team already runs on, collapsing four different records for the same account into a single resolved entity before context assembly begins. Signal is compressed and classified before retrieval: Sturdy separates bug reports from feature requests from sentiment shifts, strips noise, and ensures the highest-signal content arrives first in the context window. Permissions are enforced at the retrieval boundary, not passed as prompt instructions. The model never receives records the caller cannot see, because exclusion happens upstream of inference, not inside it.
The architectural consequence is that the model's job becomes narrower and more reliable. It receives a context payload assembled from resolved, classified, permissioned inputs rather than a window full of fragments it must filter and reconcile before it can reason. That narrowing is what makes outputs traceable. When a recommendation can be challenged, the answer traces back through the context layer to specific signals, specific entities, and specific access decisions, all of which were resolved before the query ran.
The context layer also has a compounding property the model does not. Each source connected, each entity resolved, and each workflow built on top of it increases the coverage and resolution of the intelligence available to every future query. The model running on top of that layer in 2027 will be different from the one running today. The context layer will be the same one, with more accumulated resolution. That asymmetry helps explain why context infrastructure tends to retain value across model generations, while the models themselves continue to change.
AI & ML
Stop Making Board-Level Commitments Based on Opinions
Steve Hazelton
June 2, 2026
•
5 min read
If you're a CRO, does this sound familiar: you walk into a meeting, see a green dashboard, and ask for an update. You hear the happy ears story, accept a gut-feeling MEDPICC score, and only realize a deal was a zero once it slips from the quarter.
It is a brutal way to run a business.
You are making board-level commitments based on a rep's optimism that the deal is real.
But look, it is not your fault.
You are operating in a 1990s software paradigm, where you are forced to rely on human interrogation to extract data from your team.
You hired high-level strategists, but the current tools turn them into manual data entry clerks.
When they fudge the numbers or ignore the red flags, it is a survival mechanism.
They are drowning in the noise just as much as you are, and they are telling you what you want to hear because they do not have the receipts either.
If you want to stop the slip, you have to move from trusting the update to inspecting the evidence. Here is how we look at the modern deal review:
Prioritize the Receipts over the Narrative:
• If a rep says a deal is a lock, but the CRM is a desert with zero mentions of success metrics or IT contacts, the deal is a ghost.
• Stop asking for an update.
• Start asking for the timestamp of the last technical alignment. If it is not in the language of the customer, it did not happen.
Inspect the Intersection:
• Accidents happen at intersections. In your business, that is the handoff between sales and delivery.
• If your sales data does not link to your support tickets or your implementation logs, you are flying blind.
• You need to know if the buyer is actually talking to your technical team or if those promises were never documented.
Use a Reasoning Engine to Scan the Noise:
• You cannot manually read 800 emails for a single deal.
Stop trusting the update. Start inspecting the evidence.
AI & ML
The Context Engine
Joel Passen
May 19, 2026
•
5 min read
Executive Summary
The Context Engine
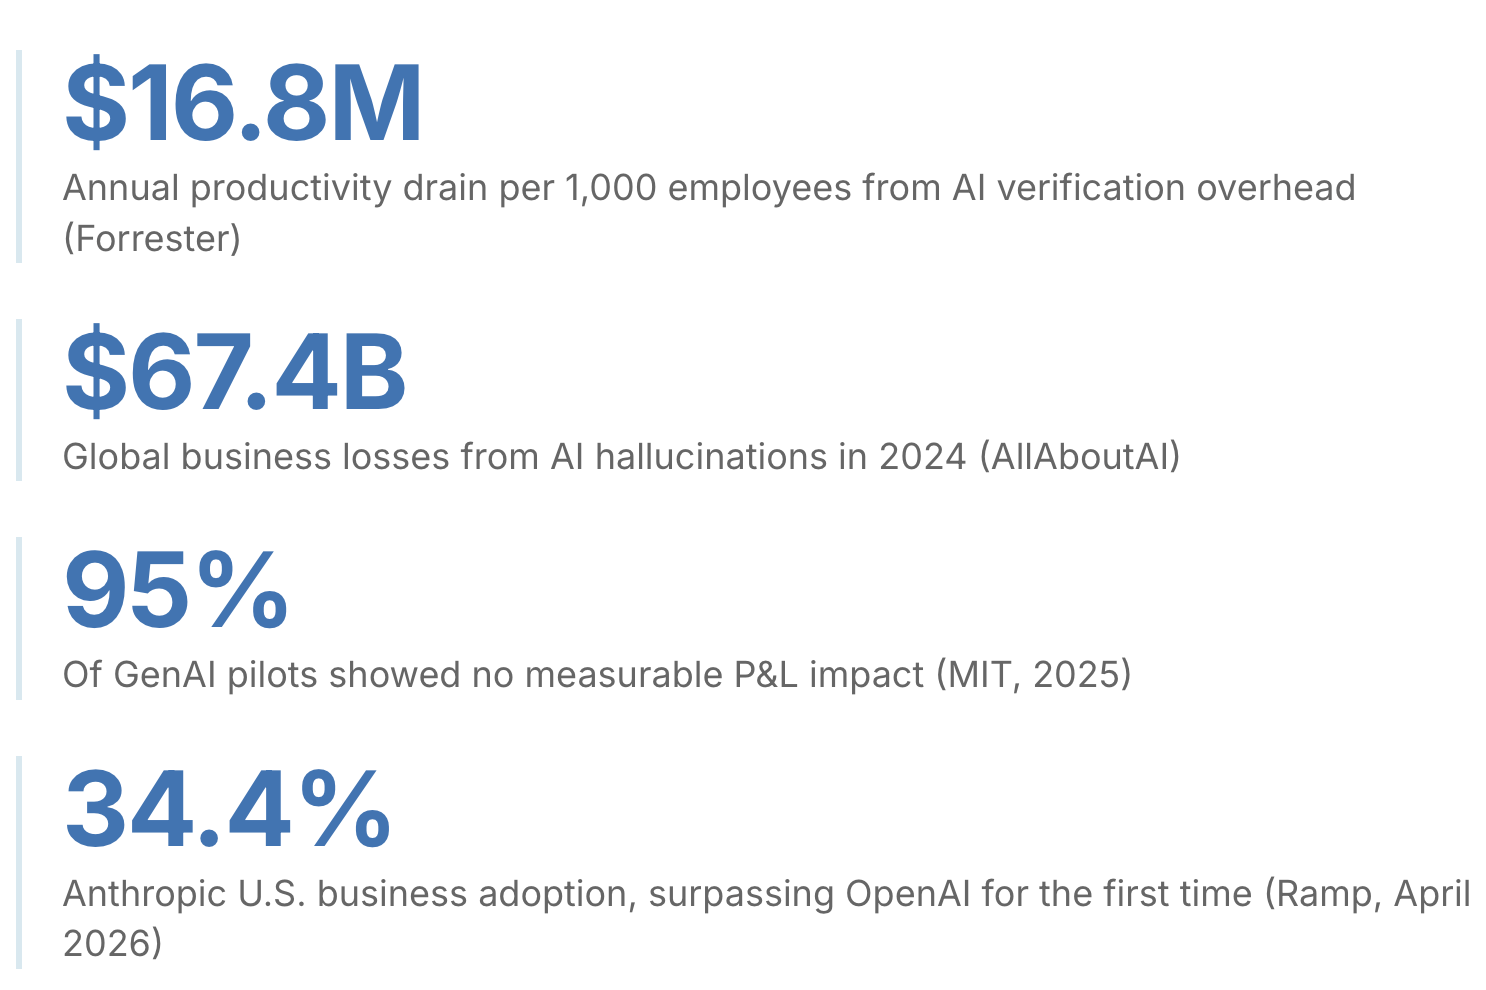
The model is not the problem. In every enterprise AI deployment that has hit a production wall in 2026, the failure lives one layer down: in how data is prepared, permissioned, and delivered before the model ever begins reasoning. Model choice has become the wrong question. With Anthropic's Claude surpassing OpenAI in U.S. enterprise adoption (34.4% vs. 32.3%, Ramp AI Index, April 2026), the market has already moved on. The competition has shifted from the Reasoning Engine to the Context Engine.
While nearly every enterprise has deployed frontier models, most are paying a Hallucination Tax they cannot see on their P&L. For an organization with 1,000 knowledge workers, the 4.3 hours per employee per week spent manually verifying AI outputs (Forrester, 2025) equates to approximately $16.8 million in annual salary drain, calculated at a conservative $75 per fully-loaded hour. Multiply that across a global enterprise, and it maps to the $67.4 billion in documented AI hallucination losses recorded in 2024 alone (AllAboutAI, 2025). This is not a failure of the model. It is a failure of architecture.
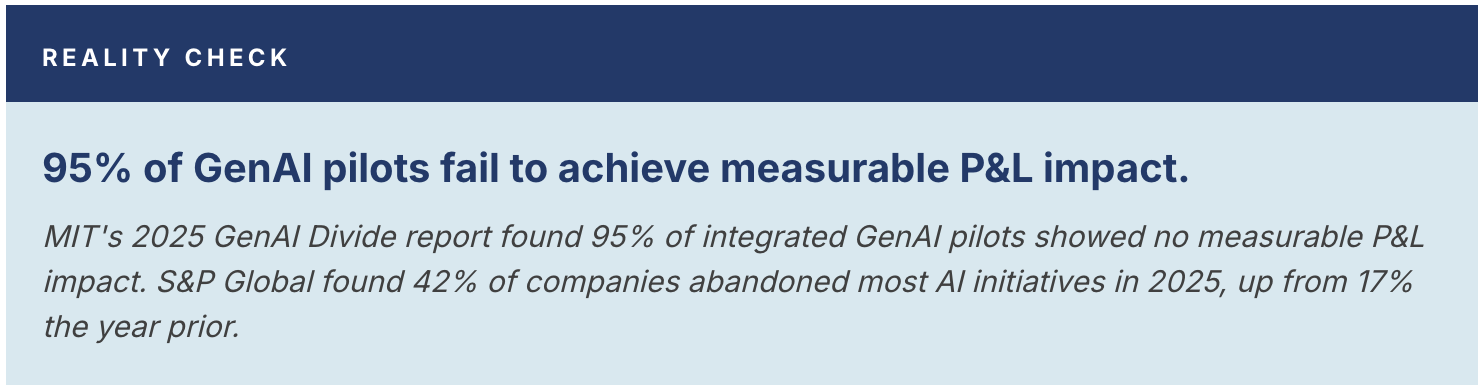
This paper argues that the next phase of enterprise AI requires a Deterministic Intelligence Layer: infrastructure that normalizes, indexes, and permissions customer data before it reaches the model. Teams replacing token-heavy RAG workflows with deterministic, pre-indexed context are seeing substantial reductions in cost per task while dramatically improving retrieval precision and AI reliability. More importantly, they are crossing the Threshold of Action: the point where AI becomes trustworthy enough to move from surfacing insights to executing workflows.
Section 1
The New Benchmark: Claude's Enterprise Breakout Moment
The AI market just had its crossover moment. As of April 2026, more U.S. businesses pay for Anthropic's Claude than for any other AI model. 34.4% vs. 32.3% for OpenAI, according to the Ramp AI Index, which tracks actual spending across more than 50,000 companies. This isn't a survey about intent. It's purchasing data.
By March 2026, Anthropic was capturing 73% of first-time business AI buyers (Axios, March 2026). A year earlier, one in 25 businesses on Ramp's platform paid for Anthropic. Today, it's nearly one in three.
Enterprise buyers don't switch defaults on a whim. They switch when something is demonstrably working better for the work they actually need done.
The Model Is Not the Problem
Here is the harder truth underneath that adoption story. Despite the crossover, most enterprise AI deployments are not delivering.
Widespread adoption. Widespread underdelivery. Both things are true simultaneously.
The instinct in most organizations is to treat this as a model problem: switch providers, upgrade to the latest version, hire a prompt engineer. None of it moves the needle in any sustained way, because the model is not where the failure lives. Claude is a reasoning engine. A sophisticated one. But a reasoning engine can only reason over what it's given. And in most enterprise deployments, what's given is a mess. Fragments.
The Performance Ceiling
Every technical leader deploying Claude at scale hits the same wall. The demo works. The pilot looks promising. Then it moves toward production, and something breaks. Not catastrophically, but consistently. The AI misattributes an item to the wrong account. It summarizes a customer's history using stale data. It generates an output that sounds authoritative and requires 20 minutes of human verification before it can be trusted.
"Feed a world-class reasoning engine confident, well-structured garbage, and you get the same in return."
This is not a failure of reasoning capability. It is a failure of context architecture. The data required to generate reliable outputs, account history, communications, support activity, call transcripts, and operational metadata typically exists across fragmented systems with inconsistent normalization, disconnected permissions, and no canonical entity resolution layer tying it together.
Context Is the New Infrastructure
The companies pulling ahead in 2026 are not winning because they chose a better model. They are winning because they solved the harder problem underneath it: delivering clean, resolved, permission-aware context before the model ever begins reasoning.
IT, Data, and Platform Engineering provide the Engine (Claude): a recurring operating expense. World-class reasoning, rented.
RevOps, Data, and AI Teams provide the Map (the Deterministic Data Layer): a long-term asset. Customer intelligence, owned.
Claude is the current catalyst. The model market will keep moving. New releases, new providers, new pricing. What doesn't move is the underlying problem: fragmented, unresolved, improperly permissioned data. Deterministic context is the durable architecture. The organizations building it now will carry that advantage into every subsequent model generation.
Most organizations already have the engine. What they lack is the map.
Section 2
The Hallucination Tax: Why Fragmented Data Kills AI Performance
If the model isn't the problem, why are so many production-grade AI initiatives hitting a performance ceiling? The answer is the Hallucination Tax.
In 2024, hallucinations cost enterprises an estimated $67.4 billion in global losses (AllAboutAI, 2025). By early 2026, the cost has shifted from outright fabrications to "silent hallucinations": outputs that look structurally perfect but are factually untethered from the current state of the business.
For an organization with 1,000 knowledge workers, the 4.3 hours lost per person per week equates to roughly 223,600 hours of wasted annual productivity, approximately $16.8 million in annual salary drain at a conservative, fully loaded rate. It never appears on the P&L as an AI cost. It shows up as underperformance, missed forecasts, and slower deal cycles.
This forces employees to act as "Human Middleware": the bridge between fragmented systems and the AI that was supposed to make them irrelevant. This tax is the direct result of four specific architectural failure modes.
Failure Mode 1: Retrieval Precision (The Token Tax)
Standard RAG is probabilistic. It retrieves semantically similar fragments, not operational truth. When a sales leader asks, "Why did we lose this seven-figure deal?", the system may surface an old QBR deck instead of the pricing objections in email, the procurement concerns buried in Slack, the legal escalation in Jira, and the product gaps discussed in call transcripts that actually determined the outcome.
Because retrieval is imprecise, teams over-index by stuffing the context window with every possible document to ensure the right one is in there. The result: thousands of reasoning tokens spent filtering noise. A world-class reasoning engine doing the work of a search index.
Failure Mode 2: "Lost in the Middle" (Attention Drift)
Research by Liu et al. (TACL, 2024) demonstrated that accuracy on multi-document reasoning tasks drops by more than 30 percentage points when relevant information is buried in the middle of a long context window. This matters enormously in enterprise environments, where critical signals are scattered across support escalations, pricing discussions, call transcripts, Slack threads, and CRM updates. Simply increasing context size does not solve the problem. In many cases, it amplifies it by forcing the model to attend to more noise.
Failure Mode 3: The Identity Crisis (Entity Disambiguation)
In a fragmented environment, identity is a variable, not a constant. "Jane Doe" in a Zoom transcript needs to resolve to the same Jane Doe in Salesforce, Gmail, Zendesk, Slack, and the CRM activity timeline. Without deterministic entity resolution, the model is forced to infer whether those interactions belong to the same person, account, or buying committee.
Without deterministic entity resolution, the model is forced to reconstruct identity probabilistically. A support escalation tied to one stakeholder, a pricing objection raised in a sales call, and an executive concern discussed over email may be incorrectly assembled into the wrong account narrative entirely.
Failure Mode 4: The Permission Ghost (Unauthorized Surface)
This is the silent killer of enterprise AI programs. Most RAG pipelines lack Source-System Parity. If the AI retrieves a snippet from a private executive email because it was "semantically relevant" to an intern's query, the system has failed regardless of whether anyone noticed.
Incidents like EchoLeak show exactly why retrieval-layer permission enforcement matters. In late 2025, researchers demonstrated a zero-click vulnerability in Microsoft 365 Copilot that could exfiltrate sensitive data from Copilot context without user interaction. No prompt injection required. The retrieval layer was the attack surface.
For most organizations, the permission layer isn't just a technical problem. It is an organizational liability that Legal and Security will eventually force you to solve on a deadline, under pressure, after something has already gone wrong.
The Production Wall
These four failure modes create the Production Wall. A curated demo can appear remarkably accurate. But production environments are not curated. They are noisy, fragmented, and constantly changing, with critical signals distributed across emails, calls, support threads, Slack conversations, and operational systems evolving in real time.
"You cannot solve these four problems by tuning the prompt. You have to solve them by fixing the context."
Section 3
The Deterministic Intelligence Layer
To climb over the Production Wall, enterprise architecture must evolve. The solution is not a larger context window or a more complex prompt. It is a fundamental shift in how data is prepared for the model. Enter the Deterministic Intelligence Layer: infrastructure that sits between your raw data silos and Claude, acting as the architectural antidote to the four failure modes in Section 2.
The Four Pillars
1. Precision Indexing (Ending the Token Tax)
Instead of relying on similarity search alone, the context layer resolves entities, removes duplication, and prioritizes high-signal interactions before retrieval. The model receives structured operational context rather than raw fragments competing for attention.
In Sturdy-observed deployments, replacing raw context with pre-indexed, distilled payloads has reduced token consumption by 80 to 90% on comparable workflows. Results vary by source data density and baseline architecture. You stop paying for Claude to be a search filter.
2. Signal Distillation (Solving "Lost in the Middle")
Semantic Pruning strips HTML headers, Slack noise, legal footers, and the RE: FWD: RE: reply chains that bury every actual decision in 40 lines of quoted text, distilling threads into thematic buckets: Bug Reports, Feature Requests, Sentiment Shifts. The most critical insights land at the beginning of the context window, bypassing the 30-point accuracy drop documented in long-context research.
3. Deterministic Entity Resolution (Fixing the Identity Crisis)
A Global Entity Map resolves disparate naming conventions into a single, immutable Customer ID. Claude is no longer guessing whether two conversations belong to the same account. It is being told they do.
4. Parity-Enforced Permissions (Exorcising the Permission Ghost)
The retrieval layer enforces source-system permissions before context assembly, so unauthorized records are excluded from the payload sent to the model. This is not a prompt-level instruction that can be overridden or confused. It is an architectural enforcement point that sits entirely upstream of the model.
Security becomes a structural property of the architecture, not a probabilistic instruction to the model. Incidents like EchoLeak show why this distinction matters: when permission logic lives inside the prompt, the retrieval layer remains an attack surface. When it lives at the data layer, it doesn't.
Reference Implementation: Sturdy + Claude via MCP
While the merits of this architecture are clear, building it internally results in years of maintenance debt (see Section 5). Sturdy leverages the Model Context Protocol to serve as the Context Engine for Claude, normalizing, indexing, and permission-stamping your customer intelligence layer across Salesforce, Gmail, Slack, and Zendesk before Claude ever queries it.
Claude provides the Reasoning Layer. Sturdy provides the Memory and Context Layer. Together, they move an enterprise from AI that reads your business to AI that acts on it.
Section 4
What It Unlocks: From Reading to Acting
In 2026, summarization is a commodity. The competitive advantage lies in moving from AI that reads your business to AI that acts on it. This transition requires a fundamental shift in how leadership views the AI stack and who owns what.
IT, Data, and Platform Engineering provide the Engine (Claude): recurring operating expense. World-class reasoning, rented.
RevOps, Data, and AI Teams provide the Map (the Deterministic Data Layer): a long-term asset. Customer intelligence, owned, not rented.
When the engine has a perfect map, the Acceleration Gap closes.
RevOps: The Revenue Architect
For the RevOps leader, a deterministic layer turns fragmented operational data into active revenue signals. Instead of building static dashboards that explain why a quarter was missed, RevOps can monitor the commercial signals that actually move deals: pricing hesitation in email, procurement delays, legal friction, competitive mentions, executive disengagement, stalled next steps, and tone changes across active opportunities.
A deterministic context layer resolves those signals to the right person, account, opportunity, and timeline before AI ever reasons over them. That is what turns scattered communication into reliable revenue action.
RevOps stops being a report generator. It becomes the operating system for revenue execution: designing the logic that turns verified commercial signals into coordinated GTM action.
Sales: Instant Account Intelligence
The average sales rep spends roughly 20% of their week on pre-call research. With a deterministic layer, the account briefing is no longer a probabilistic summary. It is a verified snapshot: "The customer's last three support tickets were resolved, but they haven't yet implemented the API update discussed in the March QBR."
Product: The Automated Feedback Loop
Product managers are often the most data-rich but insight-poor employees in the company. A deterministic layer moves PMs from reading feedback to querying insights. Claude analyzes 60 days of feedback across Slack and Zendesk and, with a single prompt, generates a high-fidelity Jira ticket including exact customer quotes, impacted account IDs, and revenue at risk.
Customer Success: Proactive Triage
In CS, latency is the enemy. A deterministic layer allows Claude to perform live triage. When a customer sends a frustrated email, the AI checks contract terms and recent product usage logs before the CSM has finished reading the subject line. It presents a Context-Aware Response ready to send, grounded in verified account data.
"The model you license today is rent. The customer intelligence layer you build is equity. One gets replaced. The other compounds."
Every account signal normalized, every entity resolved, every permission enforced. That accumulates. The organizations building this layer now are building institutional memory that makes every model they run on top of it better.
Section 5
The Build vs. Buy Reality
The instinct for most sophisticated IT and data teams is to build. It is a legitimate impulse. The stack looks deceptively simple: a few API connectors, a vector database, and some chunking logic. In the demo phase, an internal build often feels like the most cost-effective path.
The Four Hidden Engineering Hurdles
1. The Normalization Treadmill
Building a connector to Salesforce is straightforward. Maintaining the logic layer that resolves entity names across Salesforce, Slack, and Zendesk as those systems' schemas evolve is a full-time engineering job. This is Semantic Drift: hundreds of developer hours consumed by maintenance rather than innovation.
2. The Permission Mapping Paradox
Mapping row-level permissions from source systems into an AI context window is one of the most complex security challenges in modern software. Most internal builds rely on prompt-level security, which fails under the weight of incidents like EchoLeak. This isn't a technical trade-off. It is an organizational liability waiting to be forced into crisis.
3. The Latency Wall
A custom RAG pipeline often takes 5 to 10 seconds to fetch and clean data. In Sturdy-observed deployments, pre-indexed deterministic retrieval consistently operates under 1 second on production data volumes, but reaching that benchmark requires specialized search infrastructure expertise that is rarely the core competency of a generalist data team building from scratch.
4. The Token Optimization Tax
Without signal distillation, internal builds routinely pass 3x to 5x more tokens than necessary. Teams save on build costs only to spend twice as much on model API costs.
Where Does Your Engineering Dollar Go?
The strategic question isn't "Can we build this?" It's "Should we own the maintenance of this?"
Competitive advantage does not live in the plumbing. No customer chooses a vendor because their AI has a better Python script for cleaning Slack data.
By offloading the Normalization Treadmill to Sturdy, organizations are promoting their engineering teams from Data Cleaners to AI Product Owners, moving their best people away from the maintenance treadmill and toward the high-value work of building AI that drives revenue.
Buy the plumbing. Build the logic. The teams doing this are shipping revenue-generating AI workflows, while their competitors are still debugging entity-resolution scripts.
Section 6
What to Do Now: The 2026 Roadmap
The Acceleration Gap is not a permanent state. It is a choice of architecture. The move is not to wait for a smarter model. The move is to fix the context. Here are four moves for leadership to take in the next 90 days.
Move 1: Audit Your Retrieval Precision, Not Your Prompts
Most teams spend the majority of their time prompt-tuning errors caused by bad data retrieval. The action: Run a Ground Truth test. Take ten complex customer queries and manually check the data fragments Claude is being fed. If more than 20% of that data is noisy, stale, or misattributed, no prompt engineering will save the deployment. You have a plumbing problem, not a reasoning problem.
Move 2: Isolate a Multi-Source Workflow
The highest ROI for a deterministic layer is found where data is most fragmented. The action: Pick a high-value, closed-loop use case where data lives in at least three systems. For example: the path from customer feedback in Slack and Zendesk to an engineering action in Jira. Solve the context problem here, and you've built a blueprint for the rest of the organization.
Move 3: Enforce Permissions at the Data Layer
Stop treating security as a probabilistic instruction. The action: Move permission enforcement out of the system prompt and into the retrieval infrastructure. Ensure the retrieval layer enforces source-system permissions before context assembly, so unauthorized records never reach the model. The Permission Ghost is exorcised structurally, not instructionally, and the organizational liability is removed before Legal ever has to get involved.
Move 4: Define Where AI Earns the Right to Act
The distance between AI that summarizes and AI that executes is a trust gap, not a technology gap. The action: Build human-in-the-loop approval gates for high-stakes actions. Drafting a renewal contract. Creating a Jira ticket. Sending a support response. Use your deterministic layer to provide the required Confidence Equity. The threshold to target is a sub-5% error rate on AI-generated drafts. That is the point at which approval gates can be safely reduced, and workflows become self-sustaining.
Traditional probabilistic RAG architectures struggle to reach this threshold consistently at enterprise scale. Because probabilistic retrieval introduces entity errors, stale data, and permission noise, error rates on complex multi-source tasks typically stabilize in the 15 to 30% range regardless of prompt quality, even with hybrid retrieval and reranking layers added on top.
A deterministic layer that resolves entities before inference, distills the signal before retrieval, and enforces permissions before the model ever sees the data is the only architecture that makes sub-5% structurally achievable, rather than an occasional lucky outcome.
In Sturdy-observed deployments, teams that reach this threshold have consistently moved to reduced-oversight approval workflows within a quarter. Results depend on workflow complexity and baseline data quality. Reaching the sub-5% Trust Threshold is the definitive signal that an organization has graduated from "AI Experiments" to a Context Engine architecture capable of autonomous action. That is the architectural line between AI that assists and AI that acts.
Conclusion
The Architectural Advantage
Frontier models will continue to improve and commoditize. The durable advantage is no longer the model itself. It is the architecture surrounding it.
The long-term value does not live in another standalone AI interface. Interfaces change too quickly. The durable layer is the operational context infrastructure beneath them.
Organizations that solve deterministic context assembly, entity resolution, permission-aware retrieval, and operational state assembly gain a compounding advantage independent of whichever model, interface, or orchestration layer dominates next year.
Organizations that solve context architecture today are building infrastructure that compounds across model generations. As interfaces evolve and models improve, the operational context layer beneath them becomes increasingly valuable.
"The era of the Context Engine is here. Is your architecture ready for it?"
You don't have 12 months to build this from scratch.
Connect what customers say to why your numbers move. Contextual revenue intelligence, ready for any LLM — or running natively in Ask Sturdy from day one.
The four types of SaaS churn and how to calculate them
We use cookies to enhance your experience, analyze traffic, and support marketing activities. You can manage or disable non-essential cookies at any time.


.png)

.png)